Transcription initiation and elongation of HIV-1 are critical processes regulating viral latency and activation. Despite these two processes playing essential roles in HIV-1 gene expression, how they coordinate to regulate gene expression and influence the mechanisms of viral latency and activation remains unclear.
In recent years, single-molecule imaging technology in live cells has revealed that HIV-1 transcription spans multiple timescales, and closely related to the maintenance and reversal of viral latency. This technology provides temporal information on transcription, offering a new opportunity to investigate the regulatory mechanisms of HIV-1 transcription.
However, existing methods often rely on static gene expression data, making it difficult to capture the actual transcription processes, limiting systematic understanding of viral transcription. Therefore, establishing a unified modeling and inference framework for simultaneously analyzing transcription initiation and elongation, while integrating different data types, is of great significance.
READ MORE: New HIV reporter model: Visualizing HIV viral dynamics in cells with dual fluorescence
READ MORE: ‘Loop’hole: HIV-1 hijacks human immune cells using circular RNAs
Recently, Professor Jiajun Zhang’s team at Sun Yat-sen University, in collaboration with associate professor Xiyan Yang at Guangdong University of Finance, developed a dual-driven framework based on single-molecule imaging data and stochastic dynamic modeling to infer HIV-1 transcription dynamics. This work, published in Research, provides new insights and methodologies for understanding the latent regulation mechanism of HIV-1 and optimizing antiviral treatment strategies.
Dual-driven framework
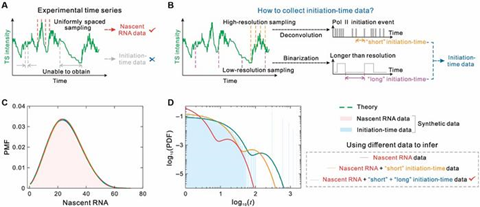
The dual-driven framework developed by Prof. Zhang’s team is shown in Fig. 1. Specifically, the team first constructed an HIV-1 transcription model covering both key stages of transcription initiation and elongation (Fig. 1A), where RNA polymerase II (Pol II) interacts with the viral factor Tat to trigger transcription, and RNA elongation drives the viral replication cycle.
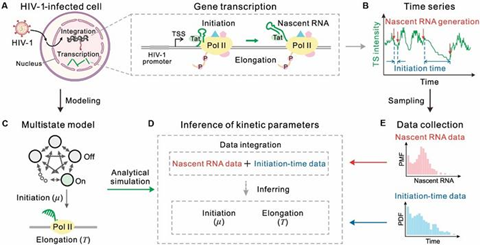
Next, the team used time-series data obtained from single-molecule imaging of live-cell nuclei (Fig.1B), which included both nascent RNA counts and time intervals reflecting transcription initiation events. To capture the multi-timescale nature of HIV-1 transcription, the study mapped the process onto a multi-state stochastic model containing multiple inactive (OFF) states and one active (ON) state (Fig. 1C).
Based on this model, the team proposed a method for integrating nascent RNA and initiation time data, using the joint distribution of these two types of data to precisely infer key dynamic parameters such as initiation rates and elongation times through maximum likelihood estimation (Fig.1D–E), providing theoretical and methodological support for understanding the regulatory mechanisms between HIV-1 latency and activation states.
1. Leveraging initiation time data for enhanced model identification
To explore the coordinated effects of transcription initiation and elongation on transcription, the authors combined theoretical analysis and numerical simulations to systematically analyze the random bifurcation of distributions of initiation times and nascent RNA counts across a large parameter space. The authors constructed a five-state loop model and systematically plotted pseudo-3D diagrams of the types of these two distributions by adjusting forward and backward transition rates (Fig2A, 2C).
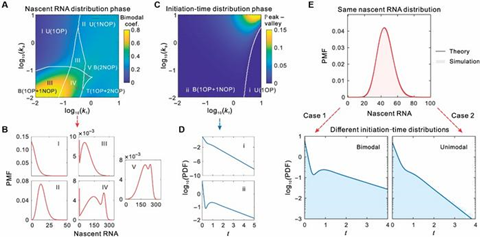
In the steady-state nascent RNA distribution (Fig. 2A), five typical distributions were identified: unimodal distributions with a peak at the origin (U(1OP)), unimodal distributions without an origin peak (U(1NOP)), bimodal distributions with both origin and non-origin peaks (B(1OP+1NOP)), trimodal distributions with one origin peak and two non-origin peaks (T(1OP+2NOP)), and bimodal distributions with two non-origin peaks (B(2NOP)).
Fig. 2B displays the representative probability mass functions (PMFs) of these regions. Meanwhile, the authors also analyzed the shapes of initiation time distributions in the same parameter space (Fig. 2C), identifying two types: unimodal distributions with an origin peak (U(1OP)) and bimodal distributions with both origin and non-origin peaks (B(1OP+1NOP)).
Fig. 2D shows the probability density functions (PDFs) of these two typical distributions. Notably, although different models may exhibit the same nascent RNA distributions, their initiation time distributions can be completely different (Fig. 2E). These results suggest that while nascent RNA data alone may not be sufficient to determine the underlying regulatory mechanisms, incorporating initiation time data significantly improves model identifiability. These findings reveal the coordinated effect of transcription initiation and elongation in regulating transcription dynamics and underscore the importance of initiation time data in mechanism identification.
2. Incorporating initiation time data can accurately infer initiation rate and elongation time
To explore the role of initiation time data in inferring transcription kinetic parameters, the authors constructed a systematic simulation framework (Fig. 3). This framework utilized two-state and multi-state models, generating time-series data using random simulation algorithms, which collected nascent RNA counts and initiation time data (Fig. 3A).
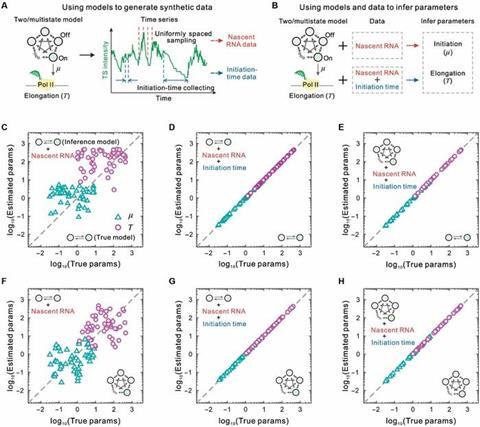
The study compared two inference methods: one using only nascent RNA data (Method I) and the other integrating both nascent RNA and initiation time data (Method II), to estimate the two key parameters of initiation rates and elongation times under different model assumptions (Fig. 3B).
Fig. 3C and 3F show the inference results using the two-state model and Method I on data generated by both the two-state and multi-state models, revealing significant discrepancies in the estimated parameters from the true values.
In contrast, Fig. 3D, 3E, 3G, and 3H demonstrate that Method II accurately estimated initiation rates and elongation times under both data generation models, regardless of whether the inference model was two-state or multi-state. This result indicates that incorporating initiation time data overcomes the limitations of relying solely on steady-state expression data for parameter inference, providing a theoretical foundation and methodological support for quantitative modeling of complex transcription processes.
3. Testing theory and inference methods using synthetic imaging data
To validate the effectiveness of the proposed theoretical and inference methods in single-molecule imaging data analysis, the authors generated synthetic imaging data to simulate real biological conditions and collected nascent RNA data along with “short” and “long” initiation time data (Fig. 4A, 4B).
The study compared three inference methods: one using only nascent RNA data (Method I), one integrating nascent RNA and “short” initiation time data (Method II), and one integrating nascent RNA, “short,” and “long” initiation time data (Method III).
The analysis of inferred transcription dynamics parameters showed that while all three methods accurately fit the nascent RNA distribution to the real distributions (Fig. 4C), there were significant differences in the inferred initiation time distributions.
Only Method III accurately matched the real distributions of initiation times (Fig. 4D). These results demonstrate that integrating initiation time data across different timescales significantly improves the accuracy of transcription dynamics inference and provides methodological support for dealing with complex real-time single-molecule imaging data.
4. Analysis of live cell HIV-1 experimental data indicates that Tat not only stimulates initiation but also promotes elongation
To further validate the applicability of the proposed methods to real biological processes, the authors applied their framework to live-cell imaging data of HIV-1 transcription. The dataset included High-Tat, Low-Tat, and No-Tat cell lines, corresponding to different levels of the HIV-1 viral protein Tat (Fig. 5A). Using maximum likelihood estimation, the authors compared the inference results based on nascent RNA data alone and those integrating initiation time data. The results showed that without incorporating initiation time data, the estimated initiation rates were significantly different from experimental values.
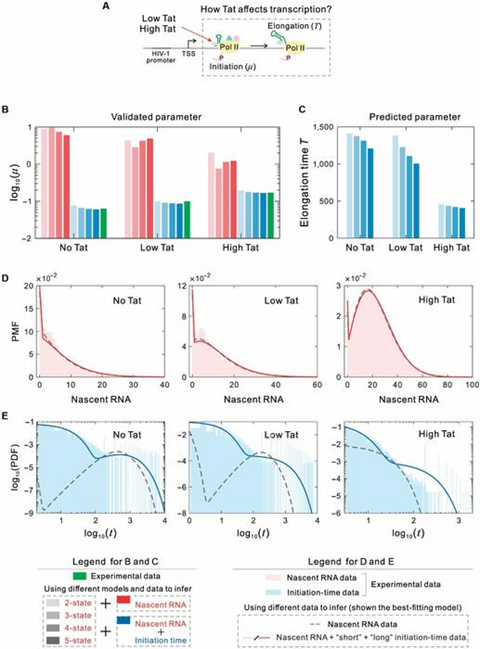
However, after incorporating initiation time data, the inferred results accurately matched experimental results, regardless of whether the two-state or multi-state model was used (Fig. 5B).
Furthermore, the authors predicted elongation times for the three cell lines and found that transcription elongation time in High-Tat cells was significantly shorter than in Low-Tat and No-Tat cells. These results demonstrate that Tat not only promotes transcription initiation but also enhances elongation, confirming the dual role of Tat (Fig. 5C). In addition, the optimal predictive model suggested that Tat induces viral reactivation and exits the latent state by altering the number of silent states of the promoter.
In particular, the study found that the inferred initiation time distribution in High-Tat cells was unimodal, concentrated at shorter time scales, while Low-Tat and No-Tat cells exhibited bimodal distributions spanning multiple timescales (Fig. 5D, 5E). Therefore, the data-integrated inference method can simultaneously predict transcription initiation rates and elongation times, providing new insights and methodologies for optimizing current HIV-1 treatment strategies.
Future prospects
The dual-driven framework combining single-molecule imaging data and stochastic dynamic models provides a new approach for analyzing complex transcription regulation mechanisms.
In the future, this framework is expected to expand to gene expression research in other viral systems, disease models, and developmental processes. By incorporating more detailed biological processes, it will promote a systemic understanding of the multi-layered regulatory mechanisms of gene expression.


No comments yet